Failed check
Fastest · more noise
A live host doesn't mean a working service. Spectra connects to the exact ports your databases, caches, and mail servers listen on — and confirms each one is open before you hear about it from a customer.

Pick a preset or enter any custom port — Spectra knows the services your stack runs on.

5432
PostgreSQL

3306
MySQL / MariaDB

6379
Redis

27017
MongoDB

25
SMTP

443
HTTPS

22
SSH

21
FTP

9200
Elasticsearch

5672
RabbitMQ

1433
SQL Server

11211
Memcached
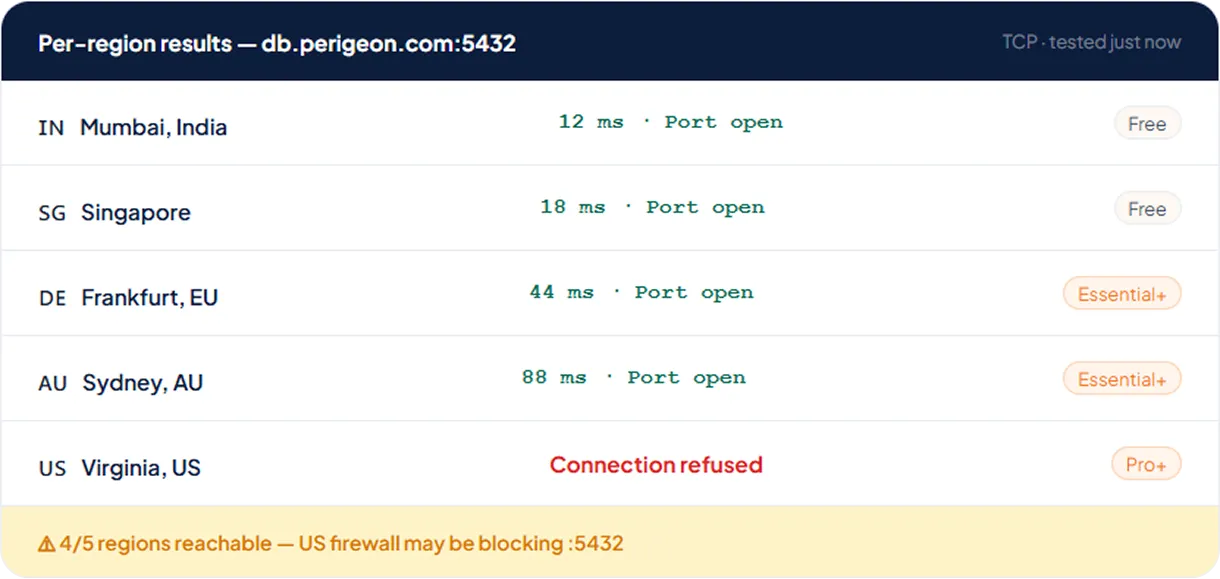
Port checks run simultaneously from multiple geographic locations. A single regional failure won't page your team — we need 2+ regions to agree before an alert fires.
Free plan monitors check from a single fixed region — a simple up/down signal to get you started.
Pick any 2 from the global list; both must confirm failure before any alert fires, so a regional blip never pages you.
Maximum global coverage. Monitor from many locations simultaneously. Avg latency, min, max, and packet loss tracked per region on every check.
If your service sits behind a firewall, use the built-in connection test to see which regions are blocked. Then allow list Spectra's probe node IP ranges per region.
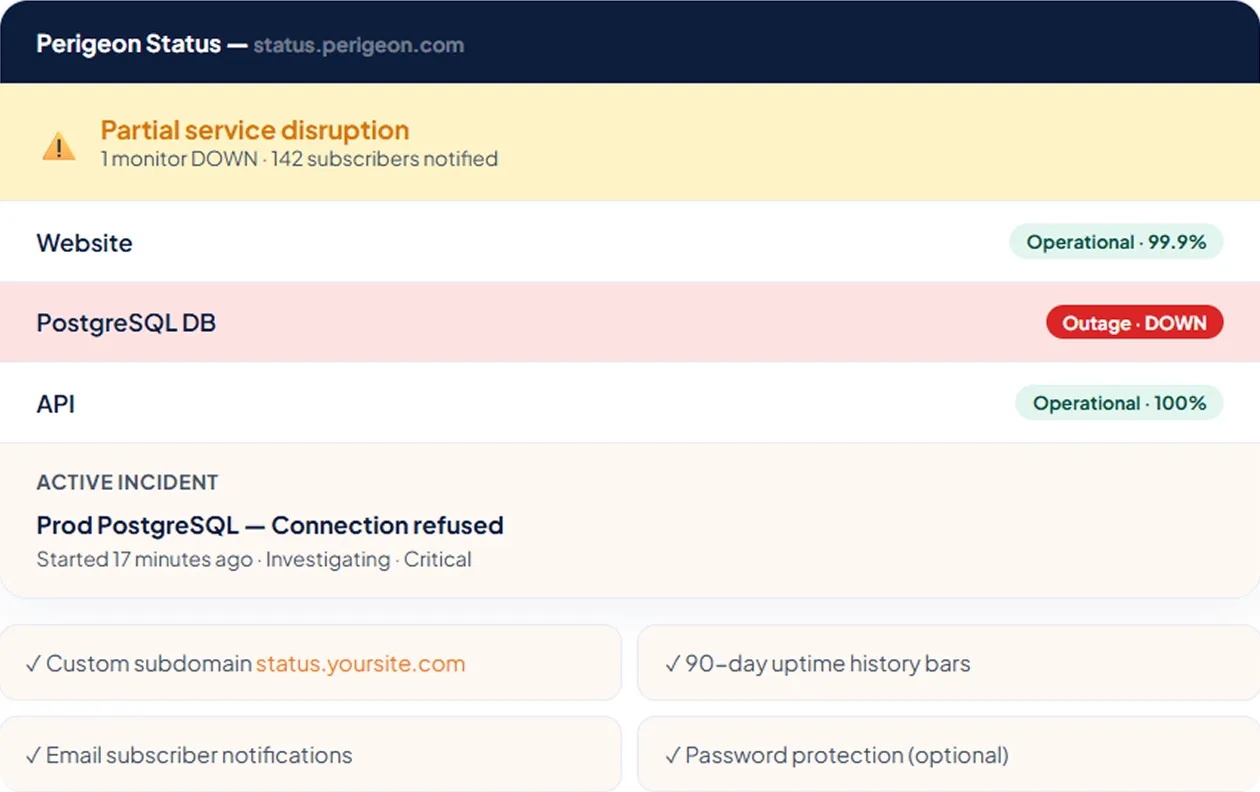
When a port goes DOWN, Spectra auto-creates an incident with a full timeline. Post status updates to your public page and track every second of downtime.
Mumbai & Singapore both report connection refused on TCP :5432. Incident auto-created.
Email sent to [email protected]. Slack alert posted to #infra-alerts. Status page updated to "Investigating".
All regions reporting port open. Connect time 12ms. Downtime duration 17m 13s. Recovery alert sent.

Every port failure auto-creates an incident. Add your port monitor to a public status page so your team and customers both know what's happening — before the support tickets arrive.
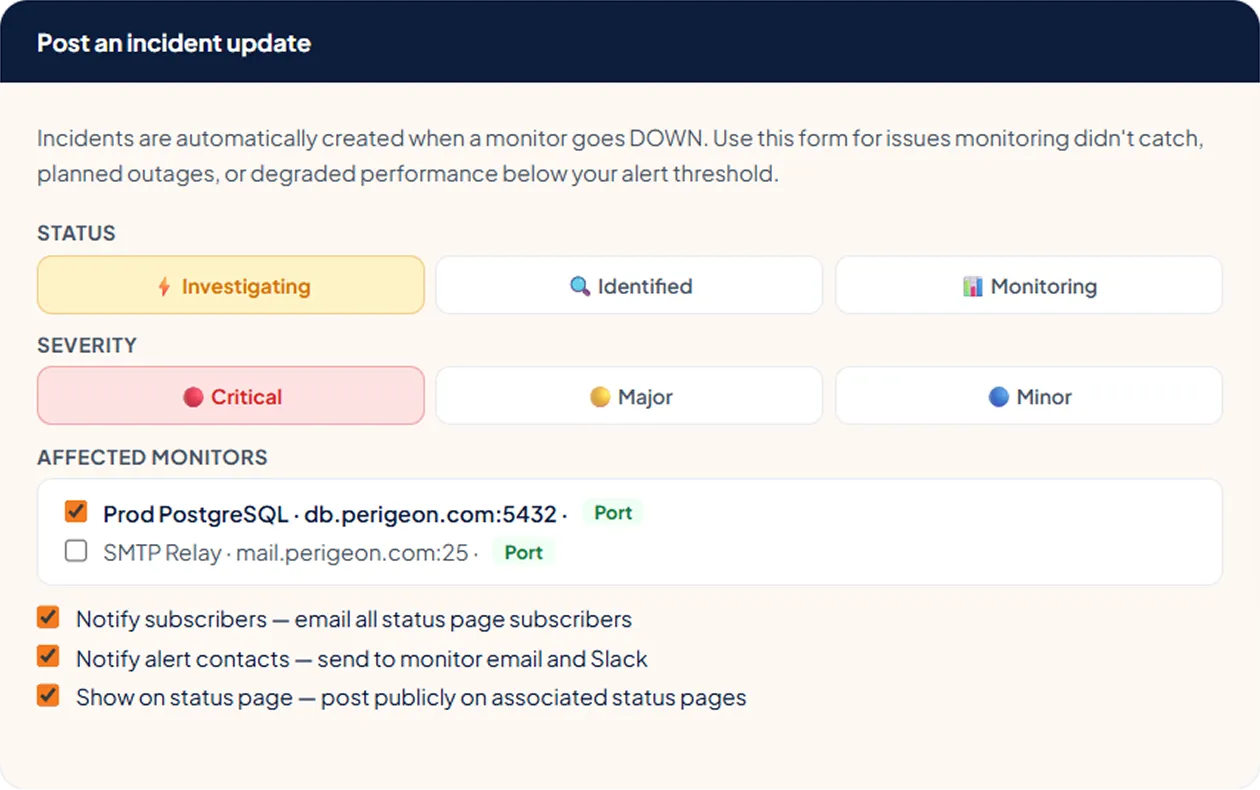
A momentary packet loss or brief network blip shouldn't page your on-call team. Require multiple consecutive failures before marking DOWN — and multiple successes before marking recovered.
Confirm DOWN after:
Confirm RECOVERY after:
Fastest · more noise
Default · recommended
Most conservative
Default · recommended
Avoids flapping
Most stable
Answers to common questions teams ask us
It checks whether a specific TCP/UDP port on your host accepts connections — confirming the service behind it (database, mail, SSH, cache) is actually listening, not just that the host is alive.
Any port. Pick from common presets like SSH, HTTP(S), MySQL, PostgreSQL, Redis, and SMTP, or enter any custom port number your service uses.
Spectra confirms a failure from two or more regions and requires consecutive failures before opening an incident, so a single dropped connection won't page you.
Yes — with private location agents you can watch ports on hosts that aren't exposed to the public internet.
Ping confirms the host answers on the network; port monitoring confirms a particular service on that host is accepting connections. Together they pinpoint exactly where a failure is.